


With EU energy prices hitting new highs, some predict that the EU carbon price will hit $100 in early 2022. Using monthly data over the period 2008–2020, CRU finds that energy prices and unexpected changes in the weather are important drivers of the carbon price. Industry variables – steel and cement – matter too. However, the relative importance of these variables is not stable over time; they vary with the economic and policy environment. CRU is developing a carbon price service to help clients navigate this complex market.

The EU carbon price has been moving up since 2018
Carbon pricing is a means of charging companies for their greenhouse gas (GHG) emissions. The EU Emissions Trading Scheme (ETS) is a ‘cap and trade’ scheme that sets an annual cap on emissions each year. The government allocates free carbon allowances to eligible companies and auctions additional allowances up to the cap. Trading is part of the system because companies whose emissions exceed their allowance have to buy carbon credits –or EU emissions allowances (EUA) – while those who emit less can sell them.
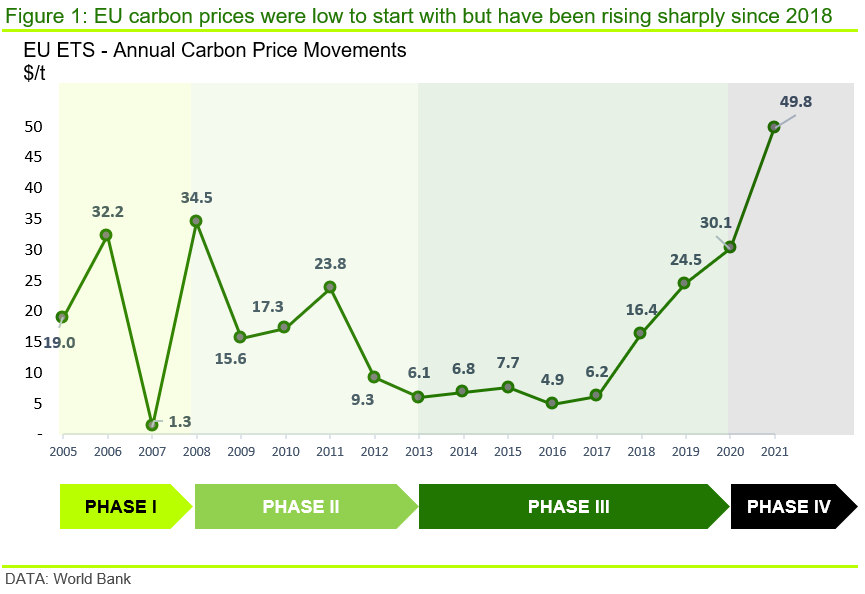
The EU ETS scheme was launched in 2005. According to the World Bank, the ‘EU carbon price’ has averaged ~$16 /t since inception. As shown in Figure 1, carbon price has been anything but stable, and has varied over time and over the distinct phases of the scheme.
EU carbon price moves have been linked to the four distinct phases of the EU ETS scheme
Phase I was a test period: its goal was to attach some form of price to carbon. During this phase companies were given most of their allowances for free and so did not have to pay much for their emissions.
Phase II began in 2008. During this phase, a cap on emissions was introduced and EUA started to be auctioned. Also, large surpluses of allowances during certain periods gave rise to a very volatile price.
Phase III began in 2013 and saw the carbon price rise to new highs towards the end of the period in 2019. A key driver for this was the decision by European Union member states to remedy the depressed market through market reforms, including the Market Stability Reserve (MSR). The MSR was announced in 2015, amended and ratified in June 2018 and became operational in 2019. Figure 1 shows that EUA prices started to rise to new highs after the June 2018 amendment, reaching an average price of ~$67/t (€60/t) by 2021.
By 2030 carbon prices will be subject to stronger market forces
Phase IV of the EU ETS began in 2020 and will continue through to 2030. The European Commission announced last year its intention to gradually reduce the amount of free allowances in the market. By 2030 there will be no free allowances. Reducing the overall cap on emissions and cutting back on free allowances will create upward pressure on the price.
CRU’s own view is that carbon prices will reach $200 /t (or €140 /t) by 2030. Some forecasters have argued that carbon prices may hit a record price of $100 /t in early 2022 “due to several bullish factors such as higher gas prices, which makes coal power plants more profitable than gas”. The rising ambition of carbon abatement in the EU post-COP26 is an additional factor that is likely to be influencing expectations of the future carbon price.
As the price of carbon increases, companies that have to pay to emit GHG will need to become smarter about how they manage these costs and how they manage their exposure to the emissions market.
In order to forecast the future carbon price, it is important to understand the past. This Insight provides such an historical analysis of the drivers of carbon prices using monthly data over the period 2008–2020.
Energy prices explain a third of the variation in carbon prices
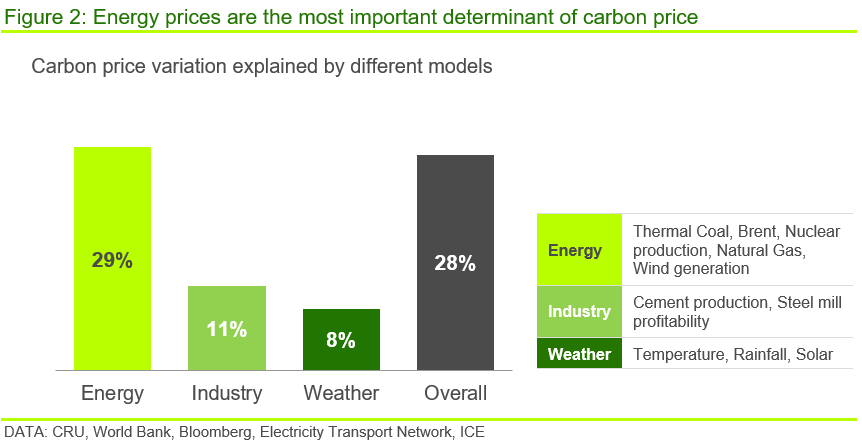
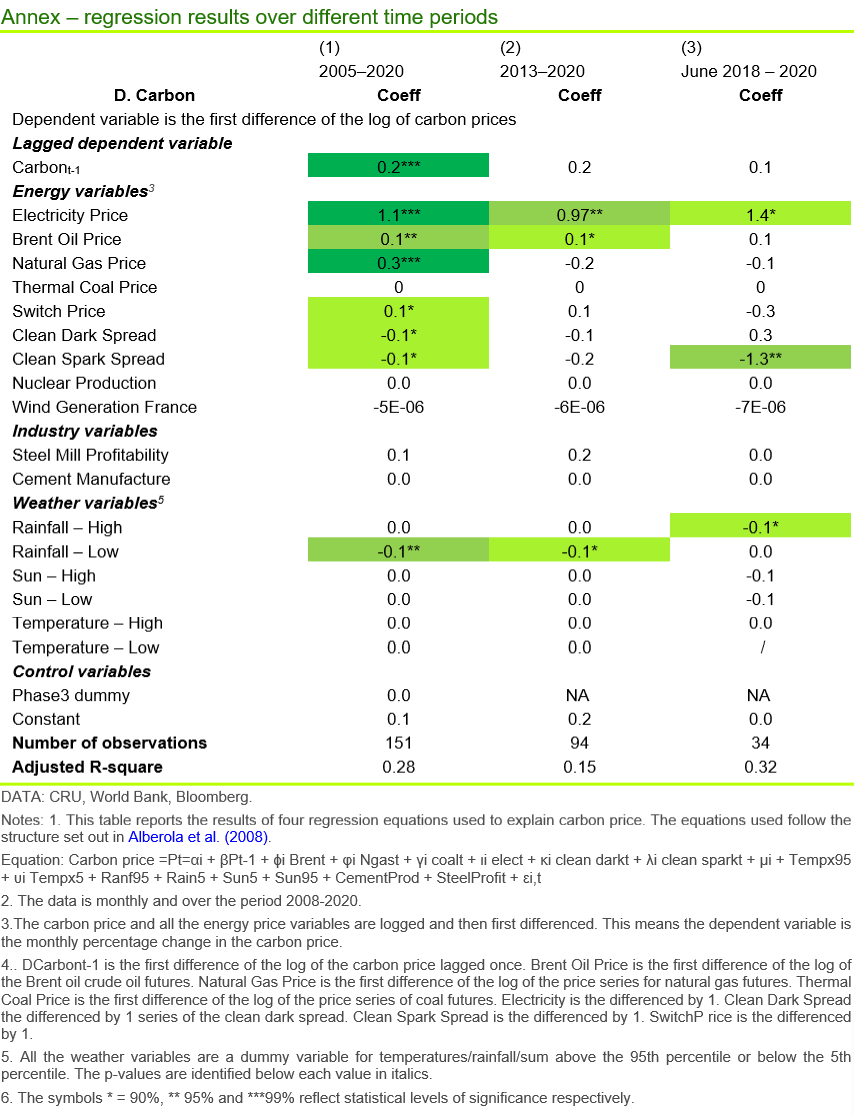
The results of our carbon price model are summarised in Figure 2 using variables defined in Tables 1 to 3. The key points are:
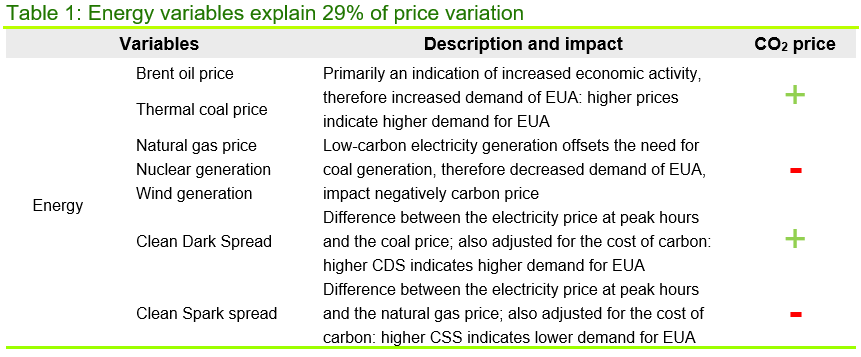
- 29% of the variation in carbon prices can be explained by Energy variables. The most important energy variables were electricity, brent crude and natural gas prices, as well as the ‘clean dark spread’.
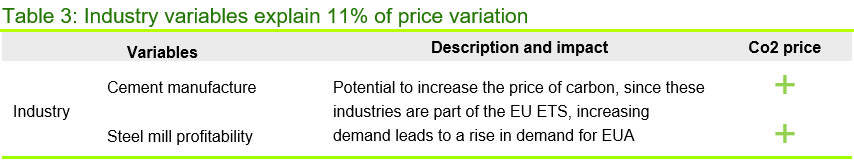
- 11% of the variation in carbon prices can be explained by Industry variables, including cement production and steel mill profitability (defined in Table 3). Over the full sample period we found the importance of energy variables tended to dominate that of industry variables, although this outcome varied across sub-samples.
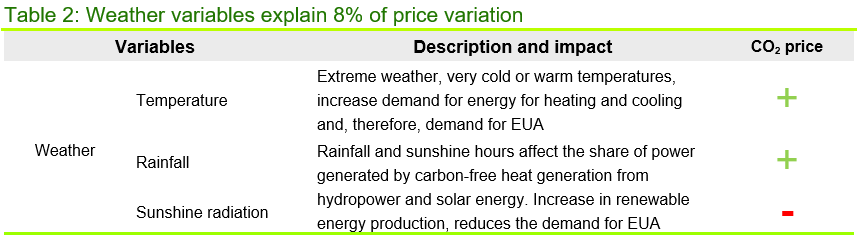
- 8% of the variation in carbon prices can be explained by Weather variables. Previous studies, which examined weekly changes in carbon prices, found that unexpected extreme weather events are an important factor. Our monthly data did not show such a strong result, which we believe is because the impact of extreme hot and cold days – and the corresponding spike in energy demand – was lost in the monthly averages.
In an evolving market, statistical relationships change too
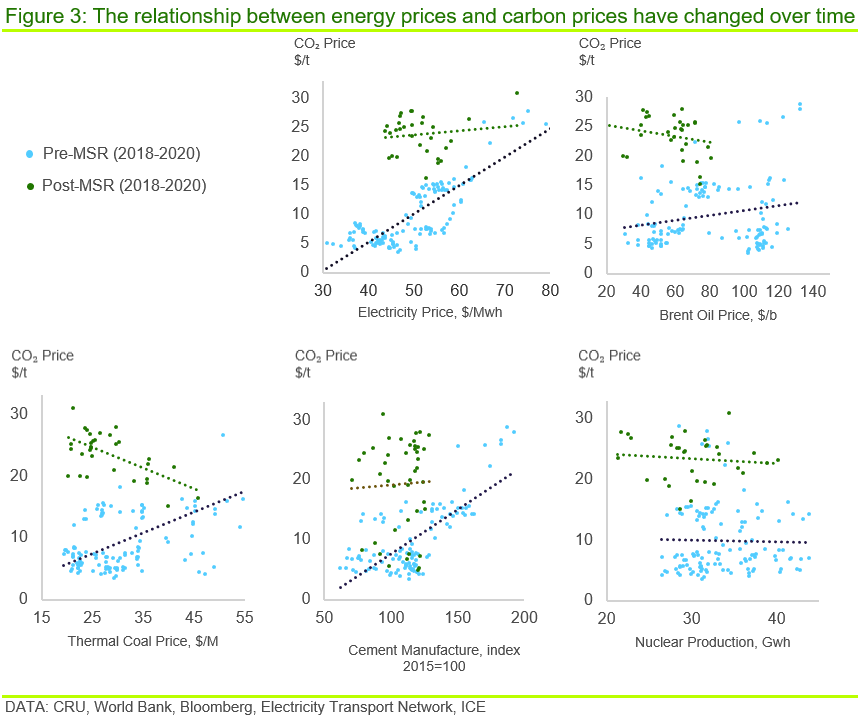
Since its launch in 2005, the EU ETS design has changed through market reforms and the implementation of new policies. As an evolving market, it is inevitable that carbon price drivers have and will continue to change over time.
Figure 3 is an example of how the relationship between the carbon price and a number of other key variables have changed over time. The green dots show the relationship since the MSR announcement in June 2018. The blue dots show the relationship before this time. It is easy to see that the correlation of key variables, and the line of bets fit, has changed over time. We expect these relationships to continue to change over the 2020s, as the rules around the EU ETS Phase IV tighten further.
Carbon model description and key variables
There are many academic studies that have tried to assess the drivers of carbon prices, usually aiming to understand the short-term drivers of the EU ETS. A recent study (Batten et al, 2017) found that energy prices could explain 12% of the weekly variation in carbon prices. Weather variables were not found to affect the carbon price unless they related to a significant unanticipated change in the weather – such as very hot or cold days. The authors of the previous study, found that, adding unexpected changes in weather to their model increased the explanatory power of the model by ~4%.
In this Insight, we build on this previous study, with a few changes. For example, to capture a longer time series, our model uses monthly data over the period 2008–2020. This time period spans Phase II and III of the EU ETS. The energy price variables, most of which are standard, are listed in the table below – oil prices, coal price, gas prices etc. The Table describes the rationale for including the variable in the model and the expected impact on the carbon price – positive or negative. The clean dark and clean spark spreads are the price differences between electricity and coal and natural gas prices, at peak hours, respectively.
Extremely cold/warm temperatures give rise to an unexpected rise or fall in the demand for energy for either heating or cooling purposes. Our model also includes weather variables that could impact the generation of renewable energy, such as levels of total rainfall (rainfall) and hours of sunshine (sunshine radiation).
Industry variables, such as steel mill profitability and cement production, have the potential to affect the price of carbon, since these industries are covered by the EU ETS. Steel mills and cement are responsible for ~14% and ~7% of emissions under the EU ETS respectively and, more broadly, steel and cement are each responsible for ~8% of global emissions. Increasing demand for fossil-based energy from these sectors will push up demand for EUA, impacting the carbon price as well. By contrast, low-carbon energy production, such as nuclear generation and wind generation, negatively impact carbon price as they reduce the need for coal-fired generation.
Carbon pricing is seen as important in enabling net zero
COP26 was seen as the world’s best chance to avoid disastrous climate change and it has raised awareness on the need to reduce emissions at a rapid pace (see CRU’s assessment of COP26). Carbon pricing is seen as an important means to enable the transition to net zero. Forecasters expect carbon prices to rise, and CRU’s view is that the EU carbon price will rise to $200/t by 2030. High emitting companies, such as those in the mining and metal sectors will need to pay more attention to carbon pricing in the next decade to minimise their cost exposure to carbon pricing.
Forecasting future carbon price developments requires a good understanding of what has driven carbon prices in the past. This Insight investigates those factors in a European context and, using monthly data over the period 2008–2020, finds that energy prices, weather and industry variables have been the most relevant drivers of carbon price in the past.
That said, another key takeaway of this Insight is that the drivers of carbon price are not stable over time – instead, they vary with the economic and policy environment. That makes understanding and forecasting the carbon price a complex task. CRU is developing a carbon price dashboard that aims to help our clients and the industries we serve better manage their risk and exposure to the carbon market.
If you want to discuss our carbon price forecasting methodology further, please get in touch. We will be happy to talk with you.
Find out more about our Sustainability Services.
Our reputation as an independent and impartial authority means you can rely on our data and insights to answer your big sustainability questions.
Tell me more