
Excess capacity is routinely touted as the major ill of the steel industry and that unfettered access to government money means that uneconomic capacity is damaging the market. But analysis of capacity and production data globally, coupled with an understanding of steel mill operations and inherent cost structure, does not support this. In fact, it seems the steel industry globally is very well structured, suggesting a highly competitive and well managed industry overall. If ‘non-commercial’ capital is available, it seems to have little effect on the proper functioning of the industry.
This is important to understand in the context of decarbonisation. As the industry decarbonises, it has been suggested this will lead to ‘further’ excess capacity, as higher emitting mills remain operational in the face of new, low carbon competition. But the analysis below shows that the industry seems very well capable of managing its capacity situation. Consequently, rather than focus on the perceived failings of the industry, this analysis suggests that the greatest impact policy makers can have is to simply ensure the industry can make the necessary decisions to decarbonise'.

Steel capacity cannot be understood from a single, high-level number
Steel capacity is a complex concept. Individual steel facilities will have a nameplate capacity and crude steel (i.e. the first solid form of steel) is typically used to define the capacity of a mill. But various factors can constrain the ability to achieve this capacity, and these need to be understood to inform the true capacity of a mill. Here, we refer to this ‘truer’ view of capacity as ‘cost-optimised’ capacity. Factors that affect cost-optimised capacity include:
- The inherent cost structure and operating requirements of a steel mill
- Physical, quality or input constraints
- Policy
Without first accounting for these factors, it is impossible to comment on the state of capacity utilisation in terms of its actual impact on market conditions.
Cost structure of the industry requires in-built ‘over-capacity’
Whilst a steel mill is normally perceived as a single entity, it is, in fact, the combination of many individual facilities, each with its own optimal performance window. It is the integration of these facilities that is needed to ensure overall successful operations. Given this, each steel mill will have an optimal operating volume that gives the best mix of material, energy, labour and other inputs across all facilities under given market conditions. In addition, steel mills have relatively high levels of fixed costs. Once production starts to fall from the ‘optimal’ operating point, costs rise. This is because fixed costs are spread over a lower volume, while material and energy inefficiencies increase. The chart below shows the conceptual shape of the cost curve for a steel mill.
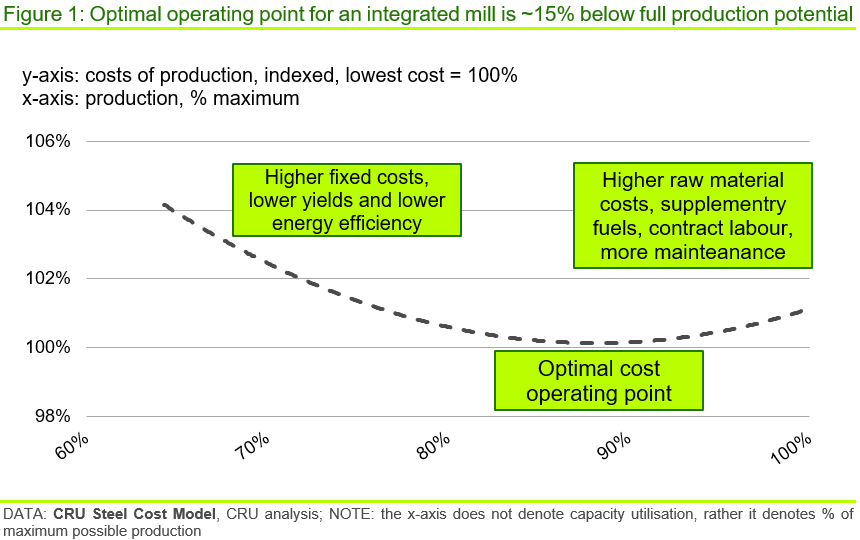
This chart shows costs rising on lower production, a minimum cost position and then costs rising beyond the minimum cost point. These latter rising costs occur when the mill operator seeks to push production beyond the optimum operating point, perhaps in a good market or for stock building prior to a major outage like a blast furnace reline. Typically, this requires the purchase of more expensive raw materials and supplementary energy (beyond existing contractual volumes), increased preventative maintenance as well as additional contract and temporary labour. These factors push up costs above the ‘sweet spot’.
In carrying out this analysis for several steel mills, typically the lowest cost position or ‘sweet spot’ sits between 85–95% of maximum production potential for integrated and EAF mills respectively. The below chart shows the same conceptual cost curve overlaid with specific analysis of three different integrated mills in the USA, Europe and China using CRU’s Steel Cost Model, which shows each following a similar pattern.
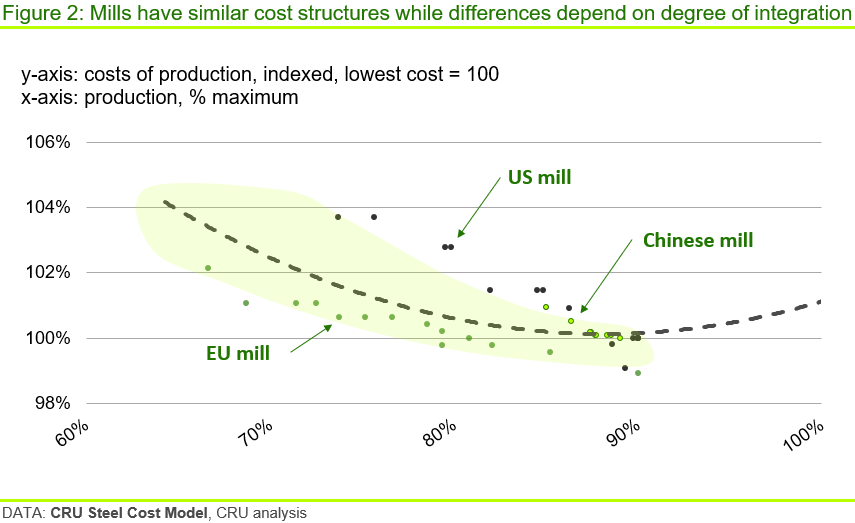
What is important here is that the cost structure of the industry dictates that, for most of the time, a steel mill will operate close to its ‘sweet spot’, which typically lies between ~85–95% of maximum production potential. Above this point, costs are higher and maintenance requirements increase to ensure safe, continuous operation and this capacity is only accessed when markets are good. That is, at the top of the steel cycle.
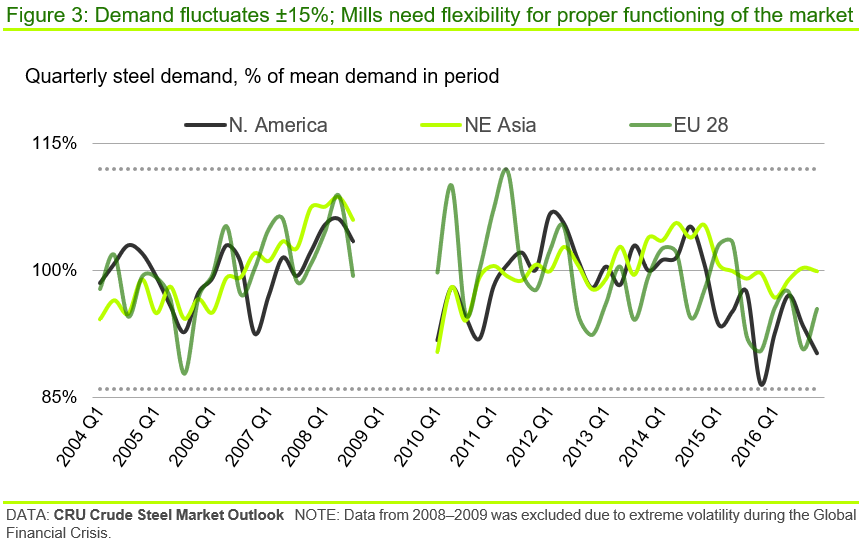
Further, from a market perspective, the chart below shows quarterly historical steel demand, which fluctuates just under ±15% of steady-state demand (n.b. quarterly demand is shown, but monthly demand is expected to be even more volatile). This illustrates the influence of market fluctuations which also dictate that mills will operate close to their ‘sweet spot’ through the cycle. That is, flexibility in production of up to ±15% of steady-state levels is needed to ensure proper functioning of the market and avoid excessive inventory requirements and/or price volatility.
The above shows that the structure of the steel industry today is optimised around the cost, operational and market factors discussed above, which require a component of ‘over-capacity’ built into the system. This ‘over-capacity’ has to be accepted as part of a properly functioning market but should not be confused with ‘excess capacity’ which, in our view, is capacity over-and-above that required to service the market.
Steel mills are complex and not all ‘capacity’ is accessible
As indicated above, mills are made up many individual facilities and it is rare – particularly as mills age – that these facilities remain in balance. Even brand-new mills often suffer from imbalances when design capacities are not met, or required raw material inputs are not available to the extent, quality or cost expected. As such, every mill suffers from bottlenecks that can occur at all points along the production chain. Typically, this means nameplate capacity of one facility, such as the casters from which crude steel capacity is defined, may not be fully accessible. In our view, capacity that is not accessible should not be included in overall capacity numbers.
To illustrate, three mills are picked out in Europe (n.b. there is no special reason to pick out these mills other than our knowledge of the operations). The first are in the UK – TSE Port Talbot and British Steel Scunthorpe – that have crude steel capacities of ~5.8 Mt and ~4.3 Mt (n.b. from the CRU Steel Capacity Database) but these mills can only access ~6.0 Mt of this capacity in total – due variously to a lack of hot metal, necessary raw material processing capacity, energy balance or market constraints. That is, there is ~4.0 Mt of capacity from these two mills that is, effectively, inaccessible under all but very extreme market conditions and that would require major operational decisions to be accessed. This capacity should not be counted.
The third mill is Liberty Ostrava that has a nominal crude steel capacity of ~3.6 Mt. However, current liquid capacity is much lower at ~2.1 Mt. As such, there is ~1.5 Mt of inaccessible capacity under the current configuration.
Combined, inaccessible capacity at just these three mills accounts for ~3% of crude steel capacity in Europe. Adding this ‘inaccessible capacity’ to the liquid steel deficit across the region (i.e. there is not enough liquid capacity across Europe to satisfy crude capacity requirements even before consideration of specific mill constraints), suggests that at least 7% of nominal crude capacity is inaccessible under most scenarios. This figure is likely to be higher if the specific configuration of more individual mills was investigated.
To gauge how much inaccessible capacity there might be a across a wider region, the chart below shows annual capacity utilisation of the US [carbon] steel sector from 2007 until today plotted against profitability of the industry. This shows that, even under the very high levels of profitability seen last year (n.b. 2021 is shown in light green, the US steel industry was not able to achieve better than ~85% capacity utilisation.
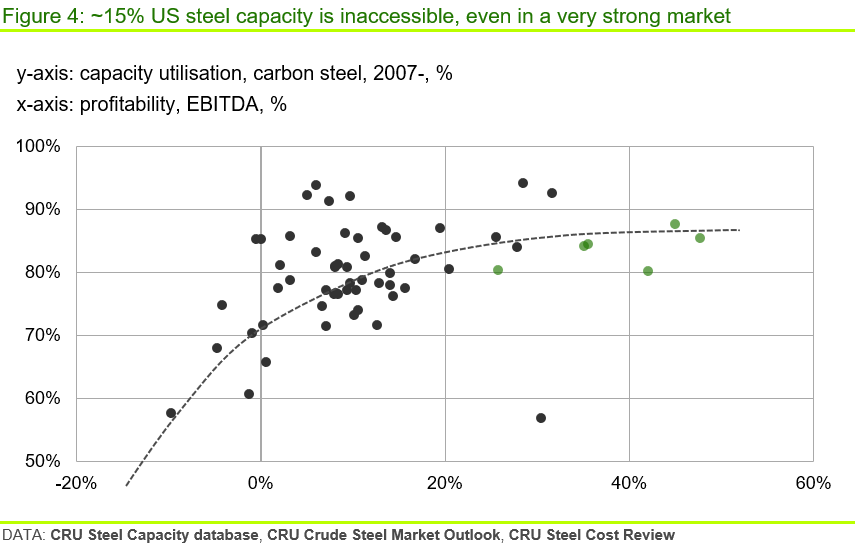
The extreme steel supply/demand imbalance seen through 2021 in the USA and elsewhere – typified by exceptionally high profitability – was a perfect platform to fully utilise all capacity available. The fact that the US steel sector was not able to lift much above 85% capacity utilisation under such strong market conditions, suggests that the full reported capacity is, in reality, inaccessible – whether for physical, raw material, quality or market etc. reasons.
Thus, looking at Europe and the USA implies that, generally, between >7–15% of nominal crude steel capacity is in fact inaccessible even under very favourable market conditions due to operational, raw material, quality or market conditions. Looking at Chinese data ~4% of capacity is inaccessible. This implies the ‘newer’ Chinese industry is better balanced – and we suggest a global figure of ~8% applies. In our view, this inaccessible capacity should not be counted when trying to assess ‘excess’ capacity in the industry.
Policy materially reduces available steel capacity
Here we look at two specific policy developments that continue to have a material impact on accessible capacity across the steel industry. The first is carbon charging under the EU ETS, and the second is China’s winter heating policy.
Under the EU ETS, European steel mills are charged for carbon emissions over and above a free allocation of emission rights. As written elsewhere, the structure of the carbon charging framework – with partial free allocation – whilst limiting the impact of carbon costs on average costs of a steel mill, severely disadvantages marginal steel volumes that compete directly with imports. The impact of this can be seen in the falling maximum production potential of the EU integrated sector as the carbon price rises. When it does, marginal tonnes are increasingly disadvantaged versus imports; and the EU integrated steel sector is less and less able to achieve historical volumes of production. The idling of BFs we see in today’s market is the first stage in the eventual closure of capacity which is the inevitable result of this disadvantage.
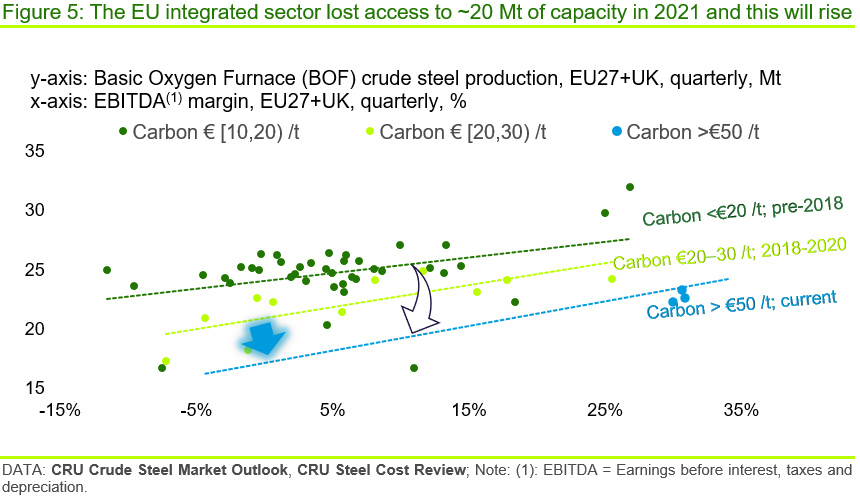
We estimate that, at current carbon prices, the EU integrated sector has lost access to ~20 Mt of production potential. We expect the carbon price to continue to rise in the EU toward the end of this decade, so the impact of this will increase. Under our forecast, we expect that over the next five years, up to 30 Mt of capacity will no longer be accessible ; and we expect to see some permanent closures as a result.
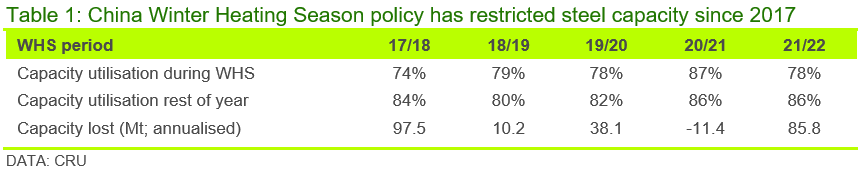
In China, since 2017, production restrictions on steel have been in place during the winter heating season (WHS), broadly between November to March, in order to limit pollution and improve air quality. This year, this was combined with further restrictions prior to the Winter Olympics. These policy demands effectively rendered some steelmaking capacity inaccessible for months at a time. The table below sets out our estimation of the loss of capacity (n.b. annualised) as a result of this. Given the WHS lasts for ~five months, this suggests capacity losses of up to ~40 Mt overall in any given calendar year.
The ongoing nature of these restrictions and of the EU ETS, means that historical and expected future capacity constraints due to these polices should be considered when assessing the ‘excess’ capacity situation. However, contrarily, we suggest the closures of blast furnaces that are specifically due to market conditions – seen in Europe currently and more generally during the Covid-19 period – should not be specifically included in any assessment of ‘excess’ capacity, partly as this would be double counting for Europe, but also because they are market driven (i.e. they reflect the fact that they represent excess capacity under the specific, temporal, market conditions in which those decisions are made).
After accounting for necessary over-capacity and inaccessible capacity, ‘excess’ capacity disappears
Once we take account of the above factors, it becomes clear that excess capacity in the steel sector does not exist – only necessary ‘over-capacity’ that is needed for the proper functioning of the market. This is set out below with reference to the position in 2021.
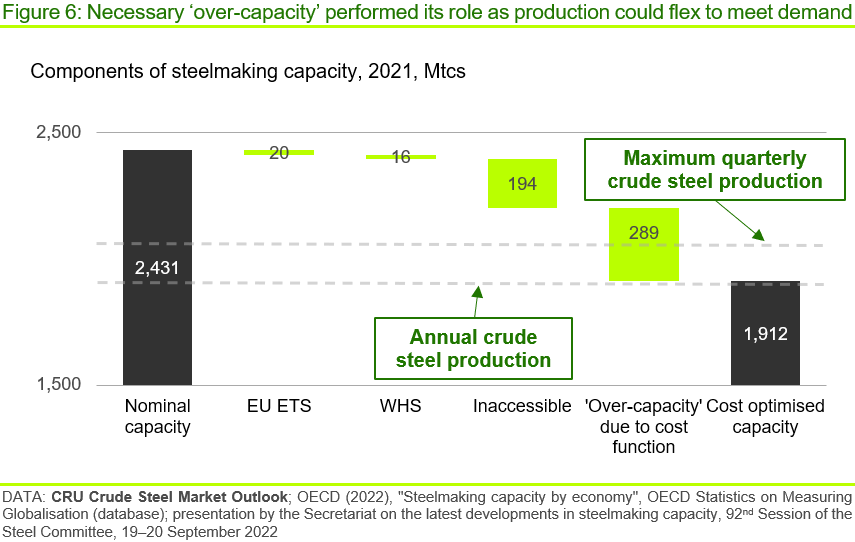
Thus, for 2021, once policy-imposed capacity constraints, inaccessible capacity and ‘over-capacity’ (that is necessary to ensure the proper functioning of the market) are accounted for, the remaining ‘cost-optimised’ capacity is approximately equal to crude steel production during the year. Indeed, from the perspective of maximum quarterly production, the necessary ‘over-capacity’ in the system appears to have performed its role very well in 2021 by allowing production to flex upwards to meet demand. Having said this, it could be argued that not all of the ‘over-capacity’ was, in fact, available during the year, due to post-pandemic logistical constraints etc., and this is a major reason behind the high steel industry profitability during the year.
Applying the same approach across the capacity time series gives a longer-term view of capacity utilisation performance across the global steel sector.
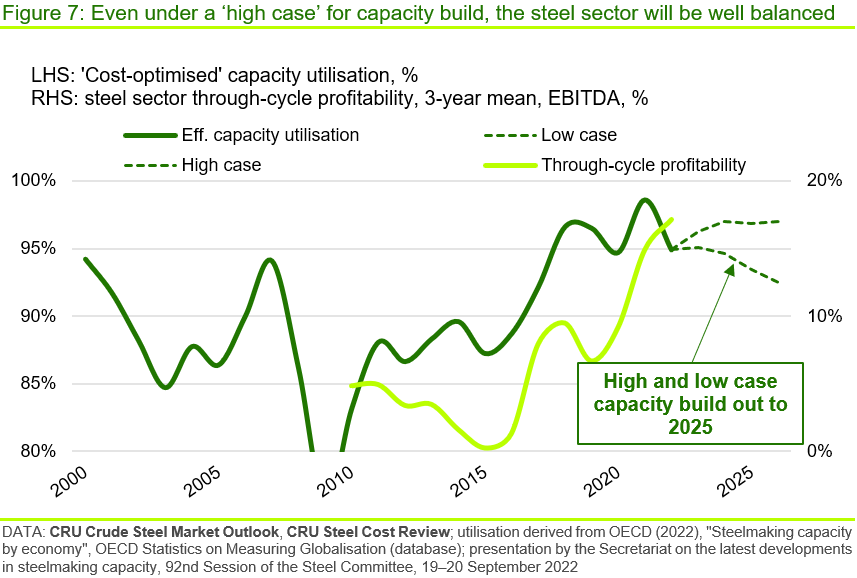
Here we can see that, from 2015, ‘cost-optimised’ capacity utilisation across the steel sector lifted, driven primarily by supply-side reform in China in our view. Moreover, since 2017 it has been at 95% or above. At the same time, we can see that through-cycle profitability lifted in tandem with this change.
Further, if we use the OECD’s low and high cases for new capacity build out to 2025 (i.e. 44 Mt and 144 Mt of capacity built respectively) and CRU’s forecast for crude steel production to 2026 (n.b. we have assumed the same build out rates for 2026), we see that, even in the high capacity build case, ‘cost-optimised’ capacity utilisation only drops to 93%, but could remain at recent historical levels, even before taking into account potential closures over the next few years. The forecast of continued high capacity utilisation, even under the high capacity build out case suggests that there is potential for through-cycle profitability to remain elevated over the next four to five years.
This analysis shows that, at the global level, steel capacity is very well-balanced with demand and that the steel industry appears capable of managing its capacity situation. The steel sector is very competitive and dynamic – and this analysis implies that even if there is ‘non-commercial’ capital involved in the industry, it appears to have had no deleterious effects on the industry structure.
Further, given the industry seems very well capable of managing its capacity, policy that ensures the industry can make the necessary decisions it needs to decarbonise will have the greatest impact. Policy that is focused on removing excess capacity that, in reality, does not exist, would simply increase volatility and uncertainty in global steel markets which would, in turn, potentially limit investment in decarbonisation.
If you want to understand how cost structure of steel production can have implications on investment, pricing and decarbonisation decisions, give us a call and we’d be happy to talk about our work.
Find out more about our Sustainability Services.
Our reputation as an independent and impartial authority means you can rely on our data and insights to answer your big sustainability questions.
Tell me more