

Increasingly, ‘green’ steel is being described as that produced from scrap in an electric arc furnace. While scrap-based steel is ultimately the lowest emission route for steel production, it is not a solution available to all and we urge industry stakeholders to avoid focusing solely on scrap use to differentiate emissions performance. Rather, stakeholders should work with all plants showing a good and improving performance regardless of the scrap available to them. To do otherwise is to decarbonise a single value chain at the expense of increases elsewhere, which does not reflect a true sustainability mindset.
In this Insight, we set out why scrap is not a panacea for the steel industry’s carbon emissions. We then set out an approach for comparing emissions performance among peer groups that, we believe, will enable all stakeholders to focus on the changes that are most viable in the near term, while progress is made on technological developments required to fully decarbonise the steel supply chain.
‘Greening’ steel needs more than just scrap
While scrap use does indeed lead to lower emissions at the plant level, it is not a panacea for the whole industry. Taking the example of an integrated steel plant that uses 10% scrap in its BOF where managers decide to lift the scrap rate to 30% to show their commitment to decarbonisation, this might entail investment to lift scrap use in the blast furnace (BF) as well as more scrap in the BOF. At the original scrap rate, emissions were ~2.4 tCO2/tcs while, all other things being equal, higher scrap use should reduce emissions to ~2.0 tCO2/tcs – a 20% reduction (see Figure 2).
Although this is a great outcome, the reality is more complicated. Steel is already the most recycled material globally, with limited potential to increase scrap availability, even with higher prices. Although available scrap will increase in the future, we already expect this will be fully recycled regardless of decarbonisation drivers – it is simply economic to do so. So, unless the plant taps into a previously unused scrap stream, this move necessarily means there is less scrap for other plants, which will need to find alternative iron units to produce the steel needed. This will come from available hot metal capacity, so emissions elsewhere will rise.
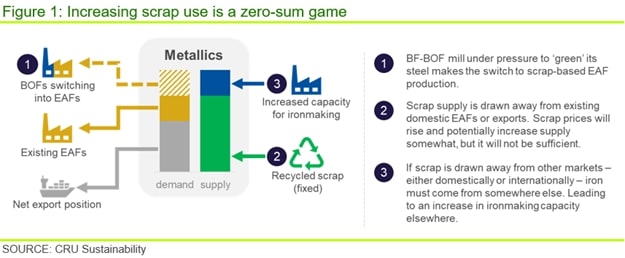
Using more scrap is a zero-sum – or near zero-sum – game and, in this scenario, there will be no impact on global carbon emissions from the steel sector. Indeed, if the steel plant that increases its scrap use is initially the operator of relatively low emission BFs, but these are closed to accommodate higher scrap use, then their output is likely to be replaced by BFs elsewhere with higher emissions. This could lead to increased emissions overall.
Thus, we believe emission performance must be defined after accounting for scrap to ensure an holistic approach to decarbonisation and to incentivise a global reduction in emissions.
Beyond scrap to measure emissions reductions
The CRU Emissions Analysis Tool shows that facilities with the same scrap input can exhibit very different CO2 emissions intensities (n.b. in Figure 2 we use full Scope 1–3 intensities, with Scope 3 values covering all major inputs). For example, the emission intensity varies between 1.6–3.5 tCO2/tcs steel for facilities with close to zero external scrap usage, whereas steel plants with an ~96% scrap share exhibit carbon intensities between 0.2–0.5 tCO2/tcs.
Therefore, in Figure 2, we have categorised the 238 steel plants in our database into three groups, namely red, amber and green – based on their carbon intensity relative to plants with the same or similar scrap rate. We label a plant ‘red’ if its carbon intensity is >0.4 standard deviations above the average of its peers’, ‘green’ if its carbon intensity is >0.4 standard deviations below the average for its peers’ and ‘amber’ where its performance is within 0.4 standard deviations of the average.
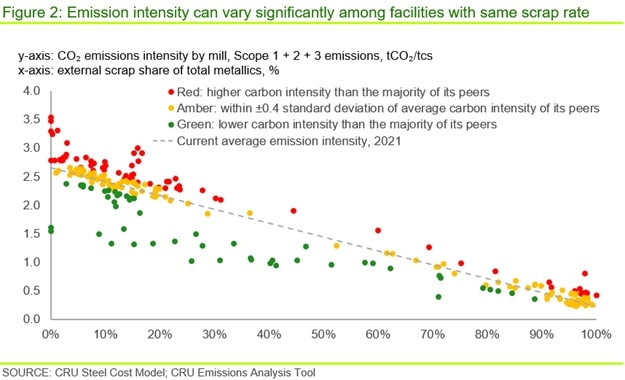
As a result, 74 steel plants in our model demonstrate relatively high emissions compared to their peers that use similar amounts of scrap and are labelled ‘red’. 114 plants are labelled ‘amber’ and 50 plants that show a good carbon emission performance relative to their peers are labelled ‘green’. Note that a largely scrap-based EAF plant can be labelled ‘red’ if its carbon intensity is significantly higher than its peers. Using this categorisation provides a different perspective on the standard emission curve.
The chart below shows the standard output from the CRU Emissions Analysis Tool and further down it is redrawn, but overlayed with the categorisation described above.
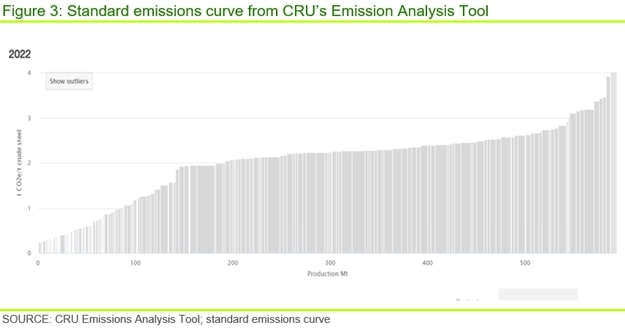
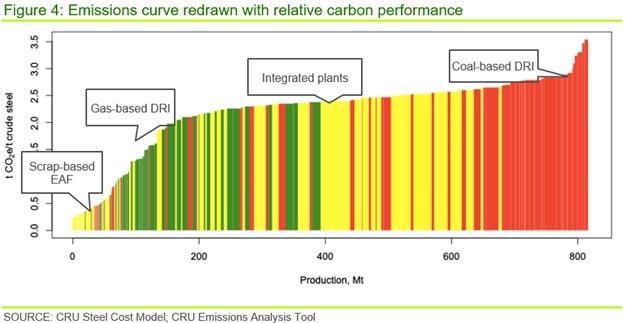
The above chart, with a carbon emission performance overlay, provides a very different perspective on the performance of individual steel plants. Now we can see that those at the top end of the curve are performing poorly relative to their peers (n.b. many of these are coal-based DRI steel plants), but there are a large number of integrated operations in the centre of the curve that exhibit either typical or better than average emission performances relative to other plants using a similar scrap charge. Interestingly, there are a number of ‘low emission’ operations towards the left that are shaded ‘red’ suggesting their emission performance is poorer than might be expected given their level of scrap use.
This approach highlights that even with increased scrap-use, there is the potential for further reductions in emissions. Consequently, focusing on increased scrap use alone is not the answer to decarbonisation. Rather, it is focusing on the genuine efforts to reduce emissions given the scrap available to the industry that will drive the right investment that will allow the whole industry to reduce emissions.
This approach highlights where the real challenges of decarbonisation lie for the steel sector. Emissions need to be reduced in ways other than simply shifting scrap around the system and this is where the focus – not only of steelmakers, but also of buyers, financiers and other stakeholders – should be.
An integrated steel plant can be ‘green’
Above, we show the limitations of scrap for improving the greenness of the whole industry but, equally, the need to focus on the means to reduce emissions from traditionally higher emitters that do not necessarily involve increased scrap use. Broader stakeholders, as well as policy, should support these non-scrap initiatives whilst the technology required to step change emissions from primary iron production – either via BFs or direct reduction – continues to develop.
If this support is not forthcoming, steel plants that supply a particular steel segment and face buyer, financier and/or policymaker demands for increased scrap use, will almost certainly be forced into making imperfect investment decisions – decisions that ultimately do not improve emissions in aggregate.
The technological step change required to improve industry performance will take time and there needs to be care in how those same stakeholders define what ‘green steel’ is today and in the future. This definition should also recognise – in addition to the limitations on scrap use – that the starting point for steelmakers can be very different.
We believe care needs to be taken not to define ‘green steel’ too narrowly. Therefore, it is useful to select appropriate peer groups and make comparisons of what is viable for that peer group and for the whole industry. Further, by using scrap consumption as a means of determining these peer groups, plants can be compared side-by-side.
In essence, this is a means of identifying the potential for further reductions in emissions that go beyond simply increasing scrap use. For example, looking at the curves above, we see that even at the high end of scrap use there are potential avenues for plants to explore further emission reductions. Likewise, at the lower end of scrap use – integrated plants primarily – some producers have very low emissions relative to other plants with a similar scrap charge. That is, some integrated plants do show a very good performance given their level of scrap use and this should be recognised.
From a steel buyer’s perspective, this approach opens the opportunity to understand the greenness of their specific supply as it compares with a wider range of viable alternatives – in other words, have the steel plants the buyers procure from achieved their full potential?
Regardless of who uses this approach, ultimately, we believe it is necessary to shift the focus from scrap use as a primary determinant of ‘greenness’ towards best practice for a given level of scrap use.
A ‘green’ plant today may not be ‘green’ tomorrow
Under IEA’s 2050 net zero emission scenario, the average carbon emissions intensity of the steel sector needs to fall by 30% by 2030 and by 75% by 2050 compared with 2020. Increased scrap availability – as a result of rising historical steel consumption coming to the end of its life – will help to lower the industry’s average intensity but our estimates suggest this can only contribute ~34% and ~43% of the required falls respectively in those years. The rest requires a real reduction of average carbon intensity at any given scrap rate.
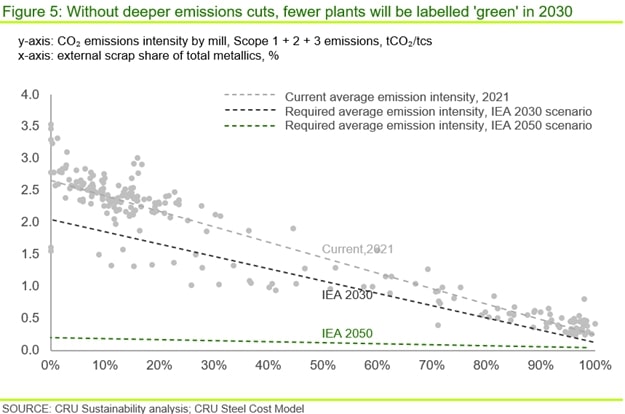
We show in Figure 5 the required average emission intensity in 2030 and 2050 as the dark grey line and the green line respectively, compared with the light grey line of 2021. Most plants, including some of the plants labelled ‘green’ in 2021 in Figure 2, are above the dark grey line. This means that, even though some plants perform better than many of their peers in terms of carbon emission control today, they would be labelled ‘amber’ or ‘red’ in 2030 if they were not able to adopt deeper emission cuts and assuming the industry remains on track for its sectoral climate target. Moreover, for 2050, all plants today would be labelled ‘red’ if their carbon intensity remained the same.
For example, natural gas-based direction reduction (DR) plants are mostly categorised as ‘green’ here because the reductant they use has a higher hydrogen-to-carbon ratio and, consequently, a lower carbon emission intensity. However, under the same configuration, these plants would not be categorised as ‘green’ in the long term and would even be labelled ‘red’ by 2050 (i.e. the net zero target requires a carbon emission intensity below 0.5 tCO2/tcs regardless of scrap rate, while most natural gas-based DR plants emit ~1.0–1.5 tCO2/tcs.
Our suggestion is that any definition adopted for ‘green’ steel should also take into account this falling baseline for carbon emissions, which reflects the steel carbon budget under a net zero strategy.
Trade policy should reflect performance, not just scrap use
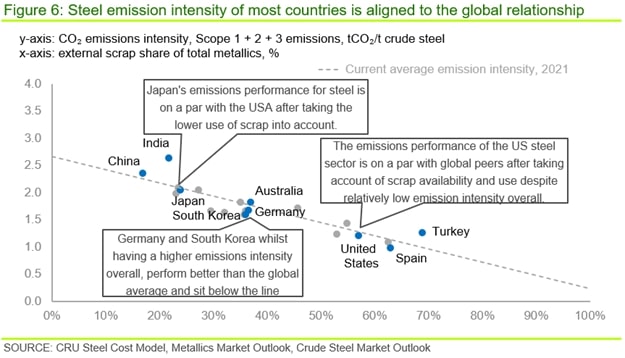
Although individual steel plant emission intensities can vary between 1–3 tCO2/tcs, at a country level most sit relatively close to the ‘best fit’ relationship between emission intensity and scrap rate (n.b. see Figure 6 below). That is, most countries possess both better and worse performing steel plants by this measure but, on average, they typically align to the global relationship. For example, the US steel sector exhibits a relatively low emission intensity overall but, after accounting for scrap availability and use, the emissions performance of the US steel sector is on a par with global peers – that is, it sits just below, but very close to, the ‘best fit’ line. Japan, in comparison, has a much higher emissions intensity overall but, given their lower use of scrap overall this is expected and, in fact, their emissions performance is broadly on a par with the USA after accounting for this. Germany and South Korea on the other hand, while having a higher overall emissions intensity – than the USA for example – perform better than the global average and sit below the line (n.b. beyond Germany, Europe more widely performs well). China performs marginally worse than the global average and Turkey and India much worse – both performances likely driven by higher use of coal for power generation and coal-based DRI respectively.
The above result is important and has implications for trade measures based on emission performance, which is a current topic of debate in Europe and the USA. We suggest that simply taking emissions intensity as a measure of ‘greenness’ – and a basis for trade policy – is too simplistic. There are important nuances to the measurement of how well an industry is performing. As we have said, scrap cannot be a solution for the global steel industry to decarbonise, either in the short or long term – there is simply not enough of it – therefore, the availability and use of scrap should not be a primary basis for differentiating emissions performance. Ultimately, this would be counter-productive in the drive to decarbonise the whole industry.
We argue that, when considering carbon border adjustments, it would be helpful for policy makers to design criteria based on the arguments put forward above that could truly help incentivise steel industry decarbonisation globally and ensure genuine additionality.
Deep, ongoing emission cuts needed to stay ‘green’
An understanding of the emission intensity of individual steel plants compared with appropriate peers, provides a measure of the ‘greenness’ of steel production that can be used to benchmark on a basis that helps achieve the best possible global outcomes. Indeed, we believe this measure could form a quantifiable component of a sustainability index. While scrap-based EAF steel is undoubtedly the lowest emissions route for steel production, scrap availability hinders industry-wide adoption. However, comparison of mills within a peer-group of common scrap usage rates means that steel produced by an integrated plant can be categorised as ‘green’ but only if that plant performs better than its peers and, over time, maintains alignment with the falling baseline or carbon budget. The latter condition is key, as it will drive change over time at a pace that is both viable for the industry and the environment.
If you are interested in sourcing or financing ‘green’ steel, the approach described here provides a more sophisticated means for identifying those steel plants that you can work with in such a way as to enable decarbonisation of the whole industry.
If you want to talk to us about using the CRU Emissions Analysis Tool or CRU Steel Cost Model to understand emission performance, contact us and we’ll be happy to talk.
Find out more about our Sustainability Services.
Our reputation as an independent and impartial authority means you can rely on our data and insights to answer your big sustainability questions.
Tell me more